May 2021
- Details
- Parent Category: resources
- Published on Monday, 13 September 2021 23:29
Reusable & Open Source Data from the Rayleigh Simulation Library
Rayleigh is a CIG-developed code, targeted at the geodynamo, that solves the magnetohydrodynamic (MHD) equations in a rotating 3-D spherical shell under the Boussinesq and anelastic approximations. The code is pseudo-spectral in nature, meaning that all state variables are represented by a basis function expansion throughout large portions of the calculation. In Rayleigh, this expansion is carried out using spherical harmonics on spherical surfaces and Chebyshev polynomials in radius. Derivatives are calculated to very high accuracy using the properties of these basis functions. This high-accuracy, a major advantage of a pseudo-spectral approach, comes with a price, however. As the fluid system is evolved in time, Rayleigh transitions repeatedly between the spectral, basis-function configuration, where derivatives are calculated, and the physical-space configuration, where basis-functions have been summed and where nonlinear terms are calculated.
This repeated cycling between data configurations can incur significant communications overhead. Rayleigh's unique parallel design substantially mitigates this issue, enabling the efficient use of large-scale supercomputing resources, such as TACC's Stampede 2 or NASA's Pleiades. Nevertheless, the dynamics occurring in systems such as the Earth's molten outer core are characterized by a broad range of spatio-temporal scales. For instance, the Earth rotates once per day, but the convective timescale in the core is on the order of a century. Ratios between diffusive and dynamical timescales are similarly extreme. This challenging disparity in timescales is pervasive throughout the other planets that form our solar system, the Sun, and other stars.
When simulating these systems, significant time is spent resolving the slowest timescales before an equilibrated state is reached and meaningful statistics can be calculated. A schematic of this is described in Figure 1 using the kinetic energy as a function of time as an example. This "up front" computational cost becomes more and more severe as parameter regimes appropriate for planets and stars are approached. While Rayleigh provides an efficient route to the equilibrated state, the substantial computational cost in reaching that state has recently motivated its user community to pool resources and create a shared repository of checkpoint data from equilibrated Rayleigh simulations.
The Rayleigh Simulation Library provides a centralized, web-accessible location in which Rayleigh checkpoint data may be stored. This growing database provides a foundation upon which new studies requiring a significant parameter space survey can be built and without the need to re-equilibrate simulations that have already been published in other work (a phenomenon that is common in planetary and stellar dynamo research). In addition to checkpoint data, auxiliary data may be provided as well. The auxiliary data could include reference information, spatial snapshots of the flow, or spectra of the various fields. Researchers who want to cover a large portion of the parameter space using many different simulations can use these checkpoints to rapidly restart a model and extract the statistics and output data relevant to the work at hand.
This resource also fosters reproducibility of results to an extent that has been inherently difficult for large computational studies to date. Without such a resource, the effective reproducibility of results can be discouragingly minimal. Practically speaking, reproducing an existing computational result would require the use of computational resources intended for new research.
Our hope is that this repository also fosters a broader sense of cooperation among the Rayleigh user community. Most users of the code study either the geodynamo or the solar dynamo. The similarities in model setup across different studies carried out within these two categories is quite substantial, and models developed for one study are easily useful for other studies. As part of this Spring's Rayleigh hackathon, we will be working with interested users in preparing geo and solar data sets for distribution through this repository. A snapshot of our inaugural, example data set is shown in Figure 2. This study of rotating convection in a spherical geometry contains roughly 70 unique simulations and spans a significant range in model parameters and simulation resolution
Useful links:
- Rayleigh Simulation Library = https://osf.io/j275z/
- CIG Rayleigh = https://geodynamics.org/cig/software/rayleigh/
- Rayleigh source = https://github.com/geodynamics/rayleigh
- Globus = https://www.globus.org
- Hindman et al. 2020 repo link = https://osf.io/qbt32/
Contributed by:
Ryan Orvedahl, UC Davis
Nick Featherstone, Southwest Research Institute
Reference
Hindman, B.W., Featherstone, N.A., Julien, K., 2020, “Morphological classification of the convective regimes in rotating stars”, Astrophys. J., 898, 120
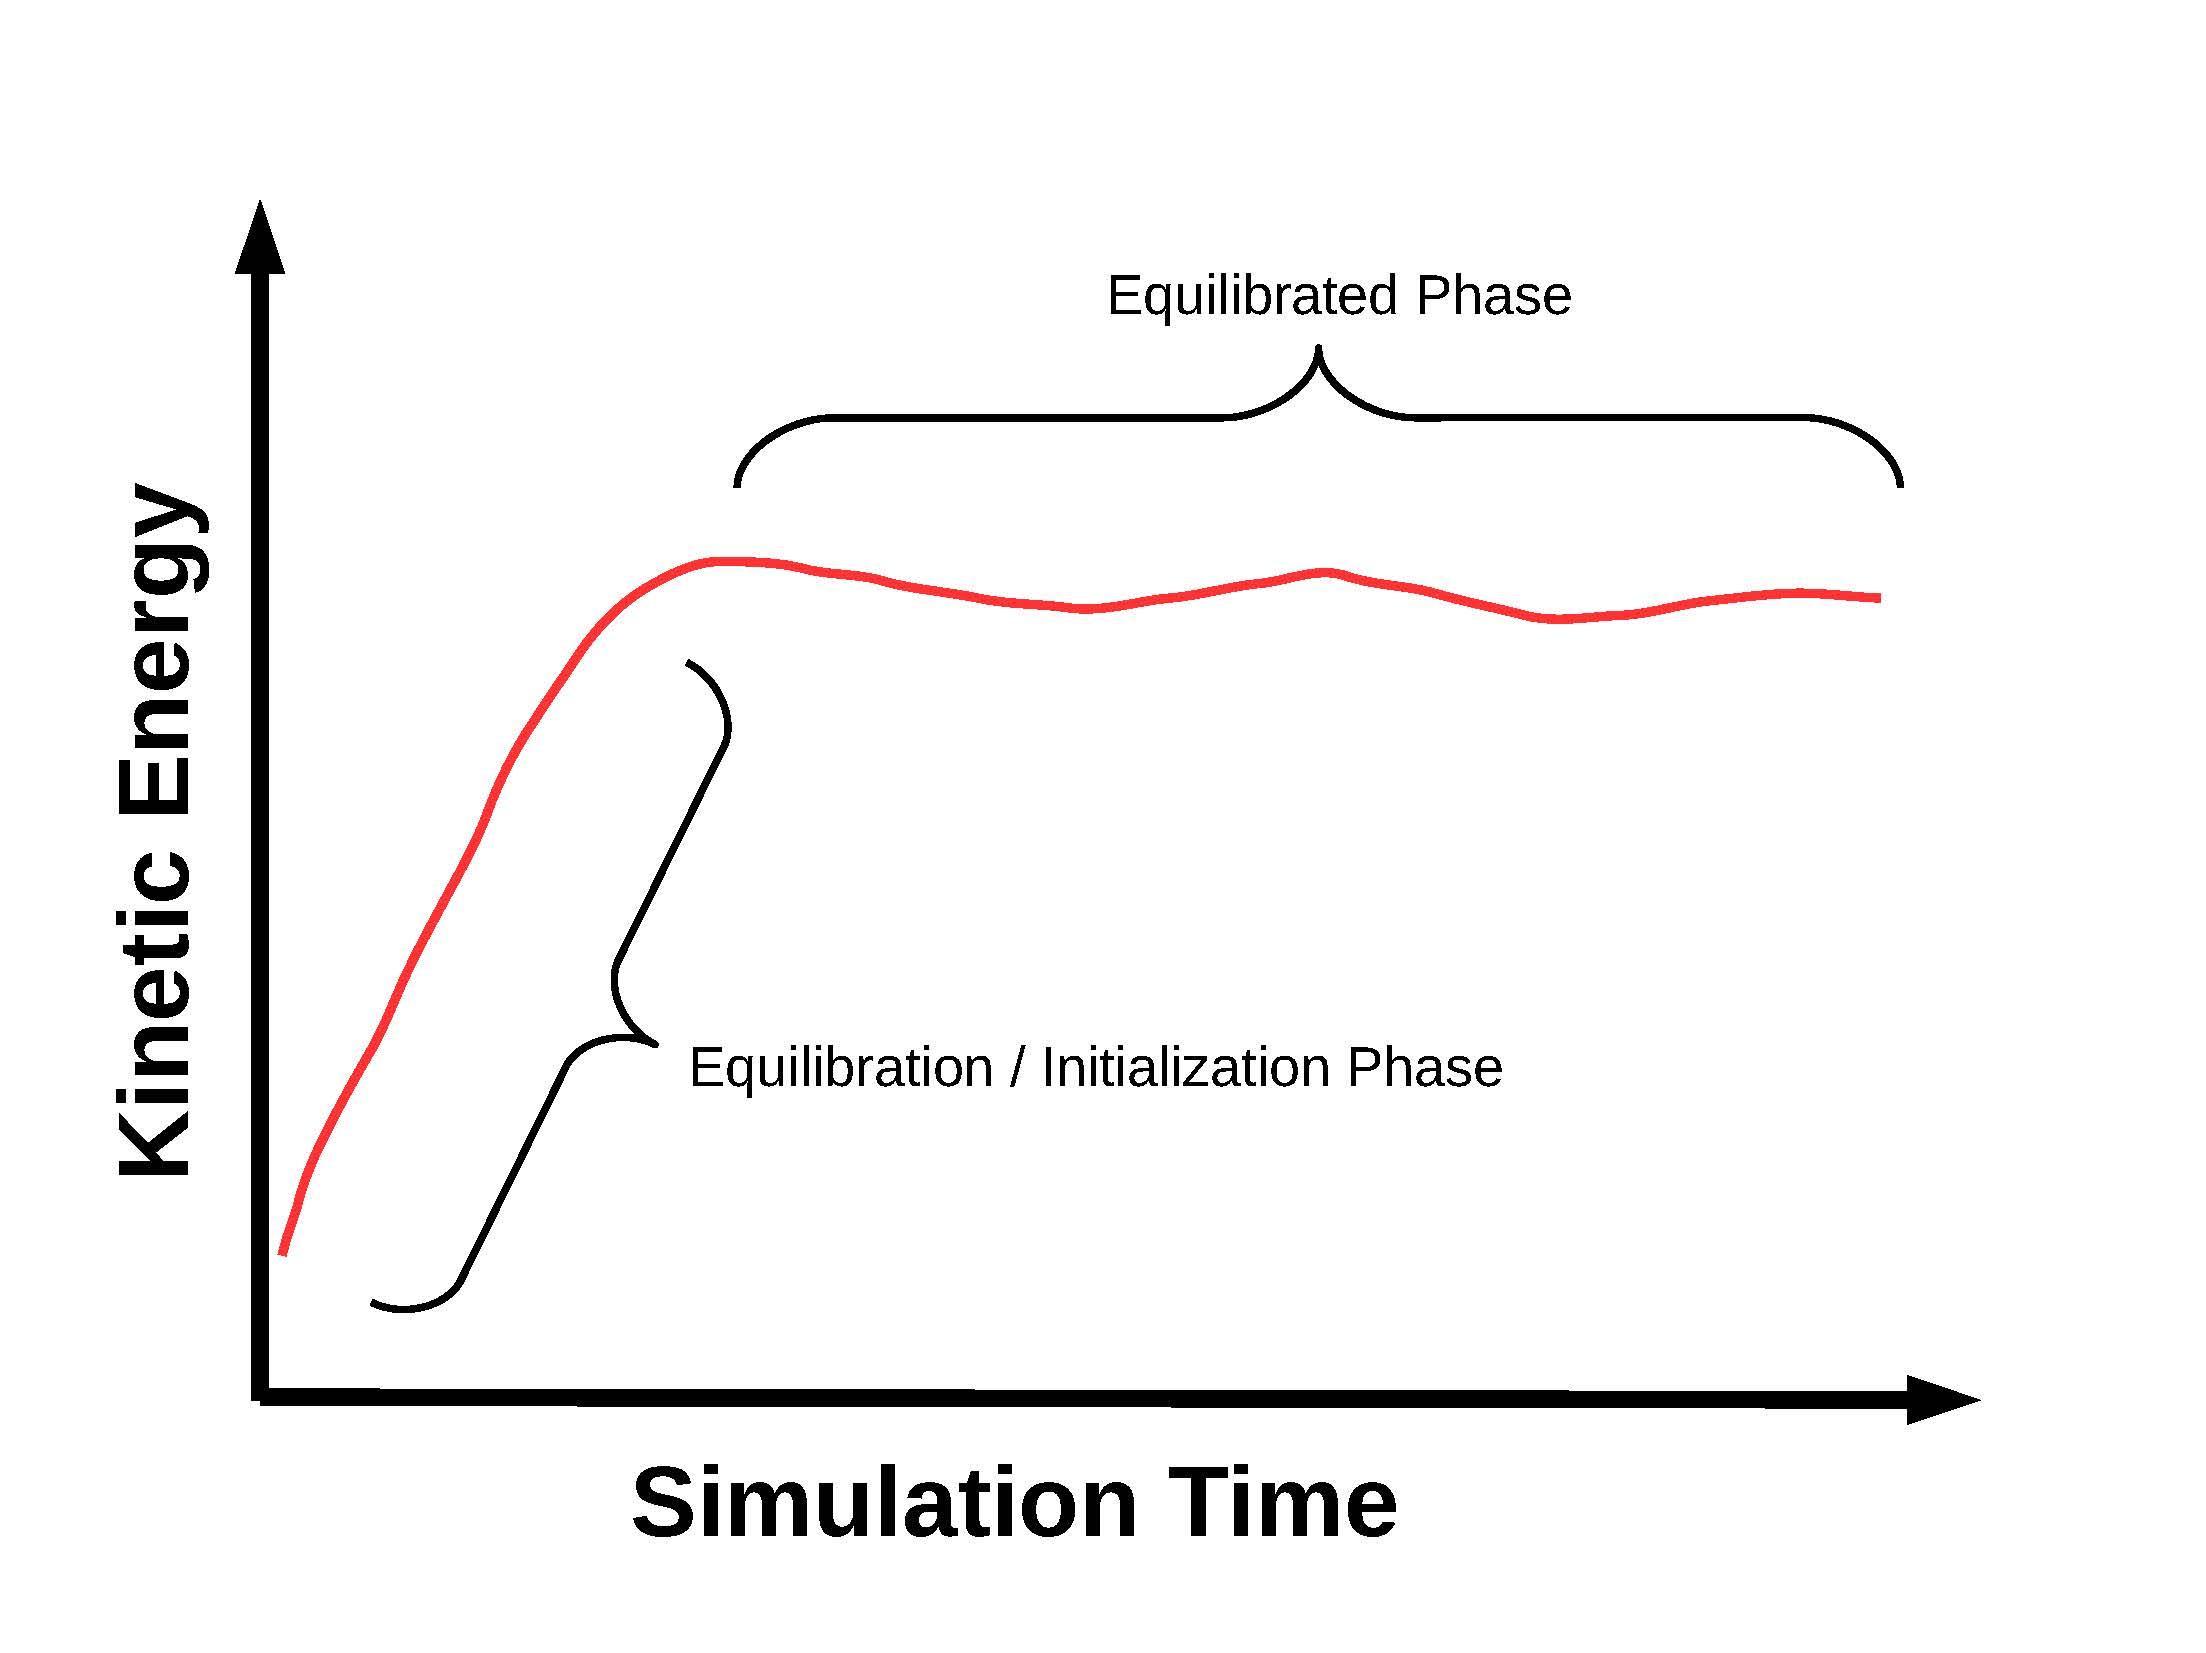
Figure 1.A schematic of what happens to the kinetic energy as a fully 3D fluid simulation evolves forward in time. At the start of the simulation, all state variables are small in magnitude and any nonlinear terms (product of small quantities) are even smaller in magnitude. This allows for an exponential growth of the kinetic energy as the system tries to reach an equilibrium configuration. As the simulation progresses further, the individual state variables grow in magnitude leading to an increase in the nonlinear terms. Once the nonlinear terms become strong enough to affect the flow, they quench the exponential growth and the system enters an equilibrated state. Once the equilibrated state has been achieved, meaningful statistics can be computed. Surpassing the initialization stage is time consuming and becomes more of a burden with more extreme parameters.
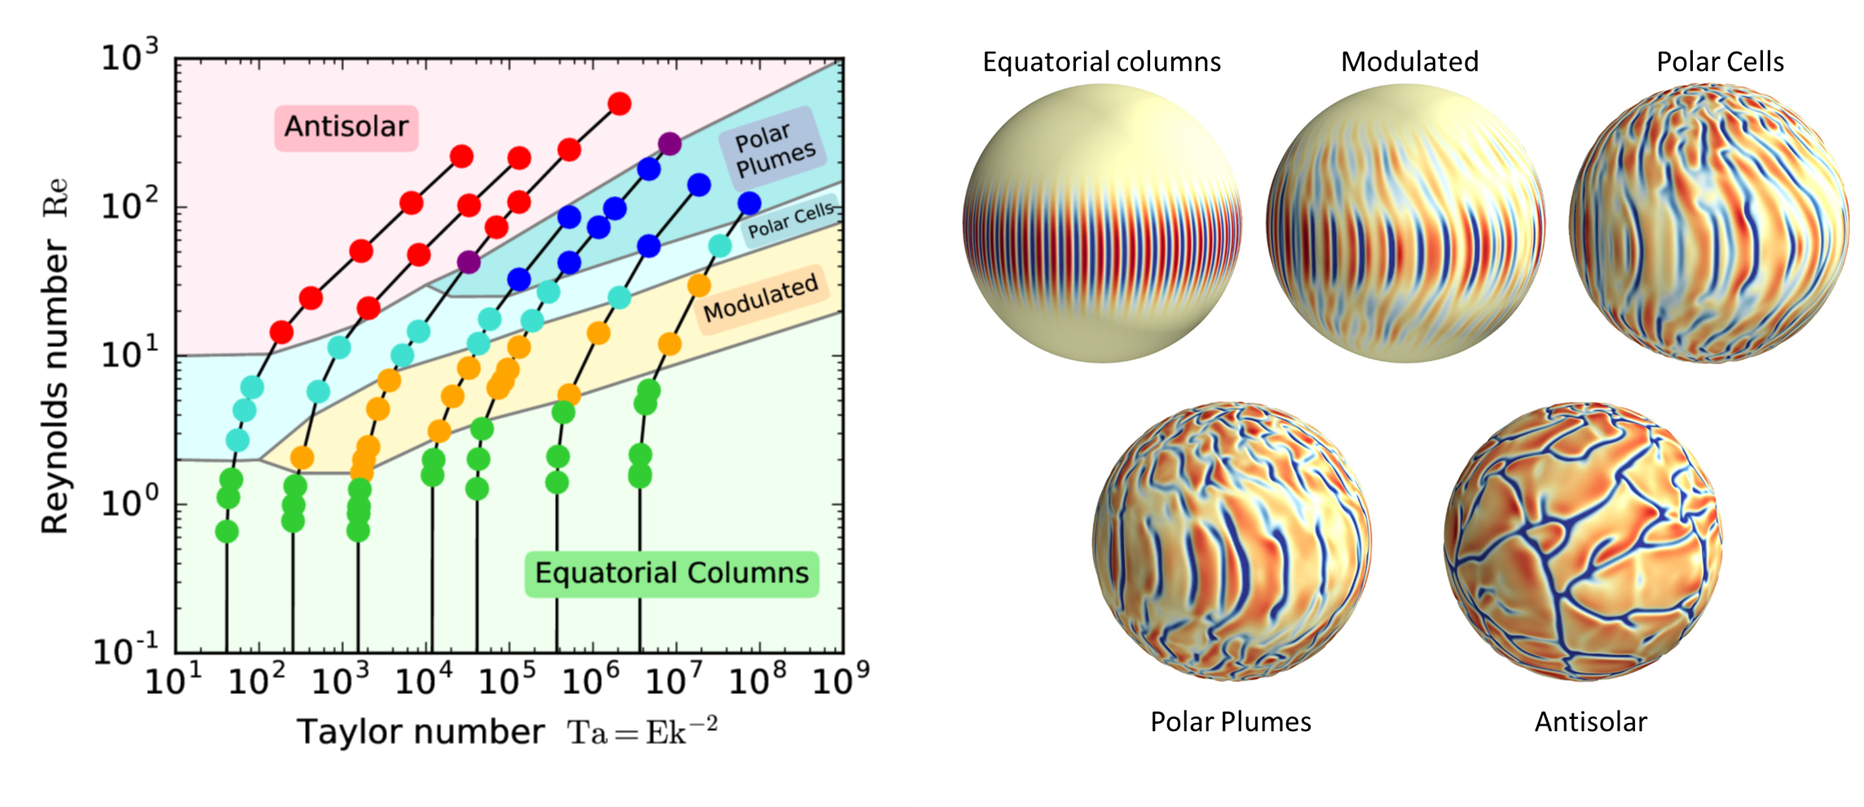
Figure 2. Systematic mapping of flow-regimes accessible to rotating convection. This study comprised the first set of data added to the Rayleigh repository. It contains 72 fully 3-D simulations spanning five different morphological regimes of rotating convection. The panel on the left provides one illustration of a phase diagram for these different regimes. The degree of turbulence increases along the vertical axis and the effective convective flow speed decreases along the horizontal axis. Examples of each flow regime are provided in the right panel, where we illustrate radial flow patterns near the top of the computational domain. Red tones denote upflow, and blue tones, downflow (Hindman et al. 2020; https://osf.io/qbt32/).