May 2024
- Details
- Parent Category: resources
- Published on Friday, 30 July 2021 11:29
Modelling Crustal Deformation for Saturn’s Moon Enceladus using PyLith
Research highlight
Enceladus is a small (~500 km diameter), dynamic, and potentially habitable moon of Saturn (Vance et al., 2023). Enceladus’s plumes, which vent water crystals sourced from a global subsurface ocean, erupt from four prominent, evenly spaced surface fractures – informally called Tiger Stripes – within the satellite’s South Polar Terrain (SPT) (Figure 1). The SPT exhibits anomalously high heat flux and regional crustal thinning (Park et al., 2024); suggesting that interrelated thermo-mechanical phenomena underlie SPT activity (Spencer et al., 2006). Moreover, observed jet activity varies over Enceladus’s tidal cycle with two peaks in activity: one after the satellite reaches apoapsis (i.e., the furthest point in orbit relative to Saturn) and a smaller peak after periapse (i.e., the closest point) (Hedman et al., 2013). These observations suggest that diurnal tides periodically deform Tiger Stripes to enable plume activity. However, the exact mechanism that regulates jet activity along the Tiger Stripes (e.g., tidally induced strike-slip or opening motion) is not well understood.
To explore a potential relationship between the dynamics of the Tiger Stripes and jet activity at Enceladus, we develop three-dimensional finite element models (FEMs) of the satellite’s crust subject to diurnal tidal loading (Berne et al., 2023a, Berne et al., 2023b, Rovira-Navarro et al., 2023). Results indicate that strike-slip motion along Tiger Stripe fault surfaces exhibits two peaks in activity over the tidal cycle (Berne et al., 2024). The inclusion of static Coulomb friction in models reduces the amplitude of one peak in strike-slip motion (i.e., shortly after periapse) relative to the other (i.e., shortly after apoapse) (Figure 2). This predicted timing of strike-slip motion strongly correlates with the double-peaked and asymmetric plume brightness variations observed at Enceladus (see Figure 3), indicating a relationship between the two phenomena. Moreover, the spatial distribution of strike-slip motion over the Tiger Stripes corresponds with that of heating observed along faults. Our results therefore suggest that strike-slip motion opens transtensional bends (e.g., pull-apart structures) along geometric irregularities over the Tiger Stripes. Under this scenario, focused extension facilitates water to rise and feed material (and latent heat) to jets, loosely analogous to volcanic processes commonly observed along terrestrial strike-slip fault bends subject to tectonic deformation (Nelson et al., 2024).
Beyond its impact on jet activity at tidal periods, we expect that friction-modulated slip along the Tiger Stripes influences the long-term evolution of the SPT. Anelasticity within the crust could diffuse tidally driven strain via permanent fault slip, viscous flow, or material failure at crack tips. For example, if fault friction enhances peak right-lateral slip relative to peak left-lateral slip during each orbit, as predicted by our work, then tidal motion would favor permanent (long-term) right-lateral slip over Tiger Stripes. Sustained right-lateral slip would concentrate northward compression over the tip of Damascus Sulcus near 90° E (and Alexandria Sulcus near 90° W) (see Figure 2) thereby promoting orthogonal extension along structures with north–south orientations centered over trailing (and leading) hemispheres. Deformation expressed over the SPT could also result from a combination of different processes that have evolved through time (for example, non-synchronous rotation of the ice shell) further complicating interpretations of current tiger stripe motion based solely on surrounding geomorphology. Testing predictions may therefore require detailed geodetic observations of fault behavior over multiple tidal periods (for example, using radar interferometry; Simons et al., 2023) for Enceladus.
Contributed by: Alex Berne, California Institute of Technology
References
Berne, Alexander, et al. "Jet activity on Enceladus linked to tidally driven strike-slip motion along tiger stripes." Nature Geoscience (2024): 1-7.
Berne, Alexander, et al. "Inferring the mean thickness of the outer ice shell of Enceladus from diurnal crustal deformation." Journal of Geophysical Research: Planets 128.6 (2023a): e2022JE007712.
Berne, Alexander, et al. "Using Tidally‐Driven Elastic Strains to Infer Regional Variations in Crustal Thickness at Enceladus." Geophysical Research Letters 50.22 (2023b): e2023GL106656.
Hedman, M. M., et al. "An observed correlation between plume activity and tidal stresses on Enceladus." Nature 500.7461 (2013): 182-184.
Nelson, Kate M., et al. "Total CO2 budget estimate and degassing dynamics for an active stratovolcano: Turrialba Volcano, Costa Rica." Journal of Volcanology and Geothermal Research (2024): 108075.
Rovira-Navarro, Marc, Isamu Matsuyama, and Alexander Berne. "A Spectral Method to Compute the Tides of Laterally-Heterogeneous Bodies." arXiv preprint arXiv:2311.15710 (2023).
Park, R. S., et al. "The global shape, gravity field, and libration of Enceladus." Journal of Geophysical Research: Planets 129.1 (2024): e2023JE008054.
Simons, Mark, et al. "Crustal deformation derived from repeat-pass Interferometric SAR at Enceladus–why and how?." AAS/Division for Planetary Sciences Meeting Abstracts. Vol. 55. No. 8. 2023.
Spencer, J. R., et al. "Cassini encounters Enceladus: Background and the discovery of a south polar hot spot." science 311.5766 (2006): 1401-1405.
Vance, Steven, et al. "Does Enceladus Have an Active Core with Hydrothermal Circulation?." AAS/Division for Planetary Sciences Meeting Abstracts. Vol. 55. No. 8. 2023.
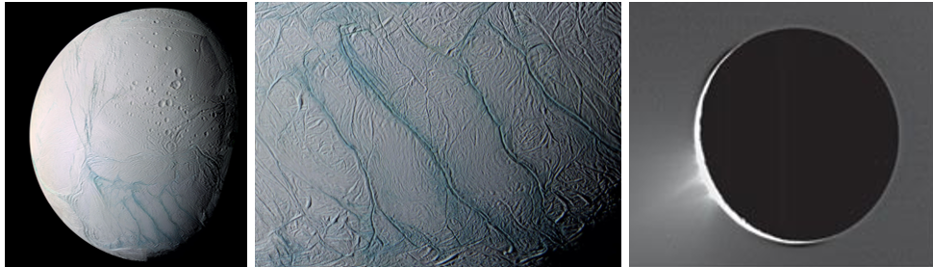
Figure 1. View of Enceladus (left), a closeup of the Tiger Stripes (middle), and a plume (right). The middle and left panels are false color images. Cassini’s high-resolution camera images courtesy of CICLOPS and NASA /JPL/Space Science Institute.

Figure 2. Examples of tidally driven deformation at Enceladus during phases of peak left-lateral slip at mean anomaly φ = 65° (a) and right-lateral slip at φ = 200° (b). Mean anomalies φ = 0°, 180° respectively denote periapse and apoapse. Top row: South Polar stereographic projections (leading and trailing hemispheres labelled) of radial displacement at the surface relative to that produced by models without tiger stripe faults. Bottom row: perspective view of lateral slip along tiger stripe faults: ‘A’ Alexandria, ‘C’ Cairo, ‘B’ Baghdad and ‘D’ Damascus. We assign μ = 0.4 to tiger stripe faults for this example. Faults are viewed from 130° W, looking upward from 35° below the horizontal. Models were developed using the 3D FEM code Pylith.

Figure 3. Comparison of predicted strike-slip motion along Tiger Stripes and observations of plume brightness. Individual solid lines correspond to magnitudes of strike-slip motion on Tiger Stripes with different prescribed static coefficients of friction μ ranging from 0.0–0.8 normalized to maximum values over the tidal cycle. Scatter points and the grey shaded area respectively denote the normalized moving average (4° bin widths) and range of plume brightness derived from Cassini spacecraft images between 2005 and 2017. The red solid line (μ = 0.4) corresponds to the model results shown in Figure 2.