
Benchmarks
Reproducing Results from the Zhong et. al. paper using CitcomS 3.2.0 The following plots are from data generated by CitcomS 3.2.0 on Stampede. Figure numbers correspond to Zhong et al.
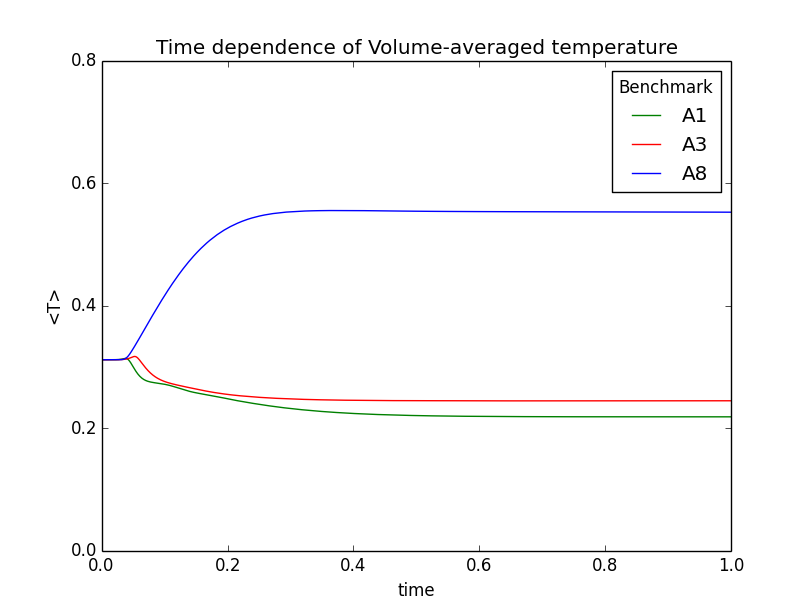
Figure 5
 |
 |
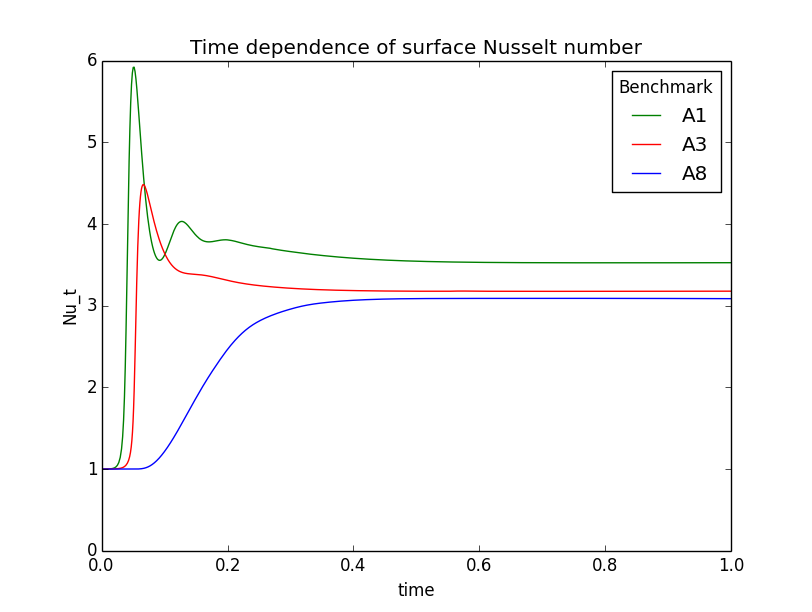 |
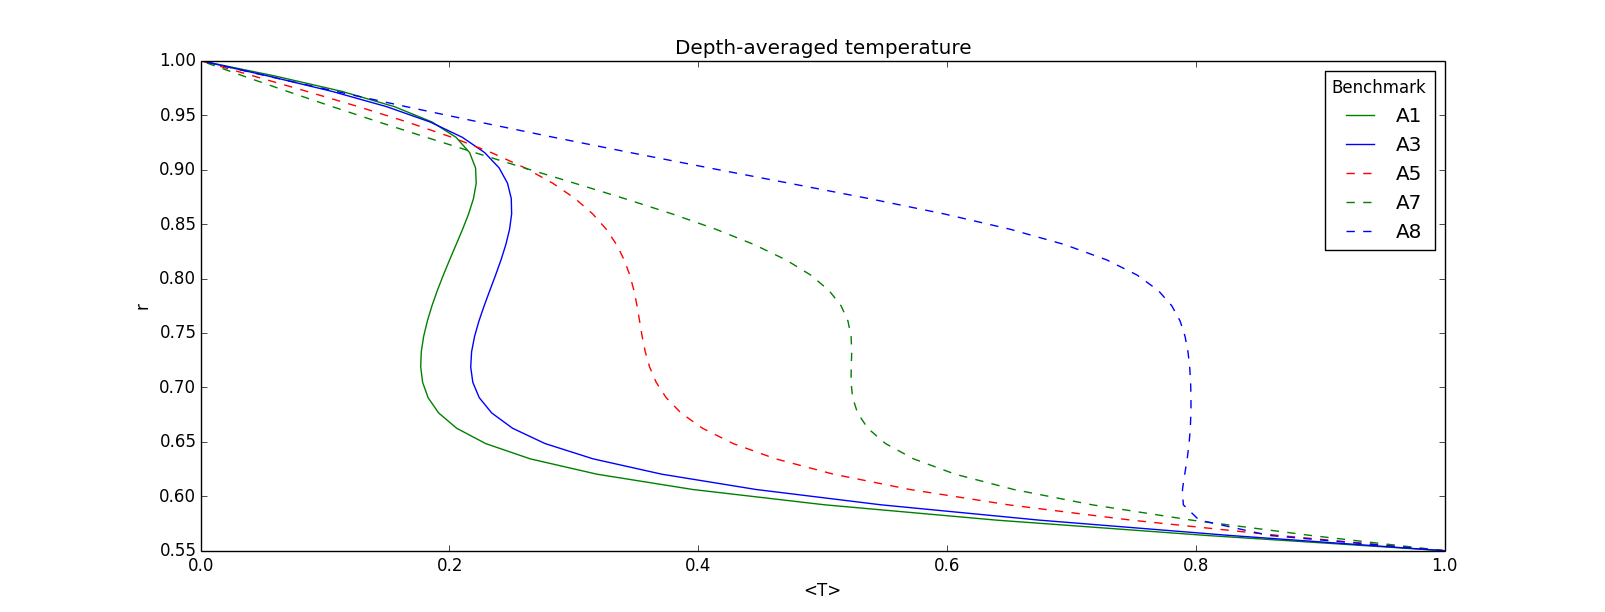
Figure 7(a)
Comparison of Values from Table 6 of the Zhong et. al. paper
Mean and standard deviations () are computed over the t1,t2 ] interval
A1
| Benchmark | t1 | t2 | < V_rms > | < Nu_ t> | < T > |
| A1 (Zhong et. al.) | 0.7 | 1.0 | 32.66 (6e-4) | 3.5126 (2e-4) | 0.2171 (2e-5) |
| A1 (CitcomS 3.2.0) | 0.7 | 1.0 | 32.68 (4e-3) | 3.5263 (4e-4) | 0.2187 (6e-5) |
| A1 (Gaia) | ? | 1.0 | 32.65 | 3.5096 | 0.2160 |
A2
| Benchmark | t1 | t2 | < V_rms > | < Nu_t > | < T > |
| A2 (Zhong et. al.) | 1.0 | 1.3 | 27.36 (1e-4) | 3.2674 (1e-5) | 0.2360 (3e-7) |
| A2 (CitcomS 3.2.0) | 1.0 | 1.3 | 27.33 (6e-3) | 3.2831 (1e-3) | 0.2381 (1e-4) |
| A2 (Gaia) | ? | 1.0 | 27.19 | 3.2550 | 0.2351 |
A3
| Benchmark | t1 | t2 | < V_rms > | < Nu_t > | < T > |
| A3 (Zhong et. al.) | 0.6 | 0.9 | 25.85 (1e-3) | 3.1724 (3e-4) | 0.2432 (3e-5) |
| A3 (CitcomS 3.2.0) | 0.6 | 0.9 | 25.77 (1e-3) | 3.1768 (3e-4) | 0.2447 (3e-5) |
| A3 (Gaia) | ? | 1.0 | 25.65 | 3.1601 | 0.2427 |
A4
| Benchmark | t1 | t2 | < V_rms > | < Nu_t > | < T > |
| A4 (Zhong et. al.) | 1.5 | 2.0 | 23.11 (3e-4) | 2.9354 (4e-5) | 0.2653 (2e-6) |
| A4 (CitcomS 3.2.0) | 1.5 | 2.0 | 23.01 (5e-3) | 2.9175 (1e-3) | 0.2659 (2e-5) |
| A4 (Gaia) | ? | 1.0 | 22.90 | 2.9259 | 0.2663 |
A5
| Benchmark | t1 | t2 | < V_rms > | < Nu_t > | < T > |
| A5 (Zhong et. al.) | 1.0 | 1.5 | 22.90 (3e-3) | 2.5468 (5e-4) | 0.3124 (1e-5) |
| A5 (CitcomS 3.2.0) | 1.0 | 1.5 | 22.86 (3e-2) | 2.5380 (7e-4) | 0.3126 (7e-5) |
| A5 (Gaia) | ? | 1.0 | 22.77 | 2.5386 | 0.3152 |
A7
| Benchmark | t1 | t2 | < V_rms> | < Nu_t > | < T > |
| A7 (Zhong et. al.) | 1.2 | 1.7 | 50.21 (8e-3) | 2.7382 (5e-4) | 0.5039 (1e-4) |
| A7 (CitcomS 3.2.0) | 1.2 | 1.7 | 11.09 (5e-2) | 1.8972 (5e-3) | 0.3870 (3e-4) |
| A7 (Gaia) | ? | 5.0 | 46.83 | 2.4917 | 0.4529 |
A8
| Benchmark | t1 | t2 | < V_rms > | < Nu_t > | < T > |
| A8 (Zhong et. al.) | 0.8 | 1.0 | 87.27 (4e-2) | 3.0317 (2.8e-3) | 0.5461 (1e-4) |
| A8 (CitcomS 3.2.0) | 0.8 | 1.0 | 88.01 (2e-2) | 3.0889 (1e-3) | 0.5530 (1e-4) |
| A8 (Gaia) | ? | 4.1 | 83.35 | 3.1328 | 0.5531 |
Comparison of Values from Table 7 of the Zhong et. al. paper.
Mean and standard deviations () are computed over the t1,t2 ] interval
B1
| Benchmark | t1 | t2 | < V_rms > | < Nu_t > | < T> |
| B1 (Zhong et. al.) | 1.2 | 1.7 | 31.09 (1e-4) | 3.6254 (1e-5) | 0.2176 (6e-7) |
| B1 (CitcomS 3.2.0) | 1.2 | 1.7 | 31.02 (1e-14) | 3.6212 (2e-6) | 0.2171 (3e-16) |
B2
| Benchmark | t1 | t2 | < V_rms > | < Nu_t > | < T > |
| B2 (Zhong et. al.) | 0.8 | 1.1 | 25.13 (7e-5) | 3.3721 (2e-5) | 0.2527 (2e-6) |
| B2 (CitcomS 3.2.0) | 0.8 | 1.1 | 25.09 (2e-4) | 3.3677 (2e-5) | 0.2525 (5e-6) |
B3
| Benchmark | t1 | t2 | < V_rms > | < Nu_t > | < T > |
| B3 (Zhong et. al.) | 0.8 | 1.2 | 24.35 (8e-5) | 3.3162 (2e-5) | 0.2587 (2e-6) |
| B3 (CitcomS 3.2.0) | 0.8 | 1.2 | 24.32 (5e-5) | 3.3122 (2e-5) | 0.2586 (3e-6) |
B4
| Benchmark | t1 | t2 | < V_rms > | < Nu_t > | < T > |
| B4 (Zhong et. al.) | 1.0 | 1.3 | 22.49 (2e-5) | 3.1278 (6e-6) | 0.2797 (4e-7) |
| B4 (CitcomS 3.2.0) | 1.0 | 1.3 | 22.47 (3e-14) | 3.1233 (4e-6) | 0.2797 (1e-16) |
Benchmarking Papers
Configuration files used for the Benchmarks
a-benchmarks.tgz (998 B , uploaded by Denise Kwong 2 years 6 months ago)